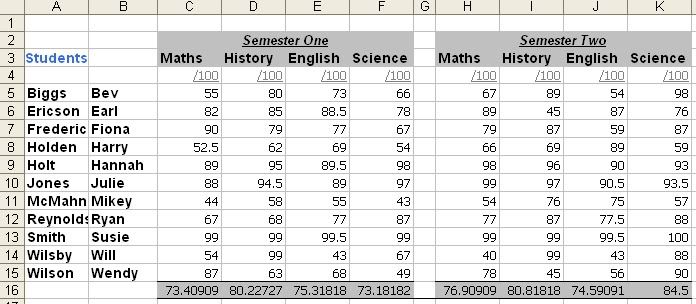
So, today in IPT, I finished up my prototype on Excel. I made the layout very simplistic and I took some screenshots which is seen below.
That's just one part of my excel spreadsheet, but I managed to finish it today. I then went on to look at Gantt Charts.
Because I do business studies, I had a definition in my textbook.
Gantt Chart: Records the number of tasks involved in each particular project and estimated time needed for each task but will not show the relationship between each of the tasks.
It was good to have an understanding of what a Gantt Chart is. I also then looked up some images on Google to see the structure of a Gantt Chart. Once I had a brief understanding, I got to work on my chart. Hopefully I will have this done by next lesson, but I have a plan mapped out in my head. Once my Gantt Chart is done, I will paste a picture here.
Thursday, 28 May 2009
Prototype!
Subscribe to:
Post Comments (Atom)

No comments:
Post a Comment